khroma and colorblindr: Tools for colorblind-friendly plots
visualization
colors
khroma - colorblind-friendly palettes
khroma contains a number of color schemes that are colorblind-friendly, divided into diverging, qualitative, and sequential types:
| type | palettes |
|---|---|
| diverging | broc, cork, vik, lisbon, tofino, berlin, roma, bam, vanimo, oleron, bukavu, fes, sunset, BuRd, PRGn |
| qualitative | bright, highcontrast, vibrant, muted, mediumcontrast, pale, dark, light, okabeito, okabeitoblack, stratigraphy, soil, land |
| sequential | devon, lajolla, bamako, davos, bilbao, nuuk, oslo, grayC, hawaii, lapaz, tokyo, buda, acton, turku, imola, batlow, batlowW, batlowK, brocO, corkO, vikO, romaO, bamO, YlOrBr, iridescent, discreterainbow, smoothrainbow |
The color function takes a palette name and returns a function, which in turn returns a palette of specified size:
     blue       red     green    yellow      cyan
"#4477AA" "#EE6677" "#228833" "#CCBB44" "#66CCEE"
attr(,"missing")
[1] NA
And you can preview these palettes with plot_scheme():
plot_scheme(bright_fun(7), names = TRUE,
            colours = TRUE) # NB: `colours` must be spelled British-ly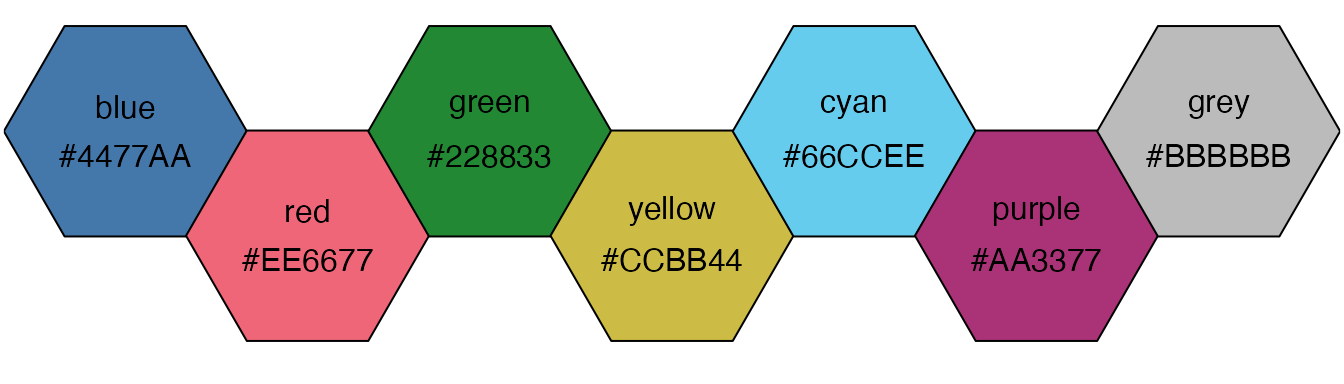
Further, you can preview the palette as viewed by several types of colorblindness:
plot_scheme_colorblind(bright_fun(7))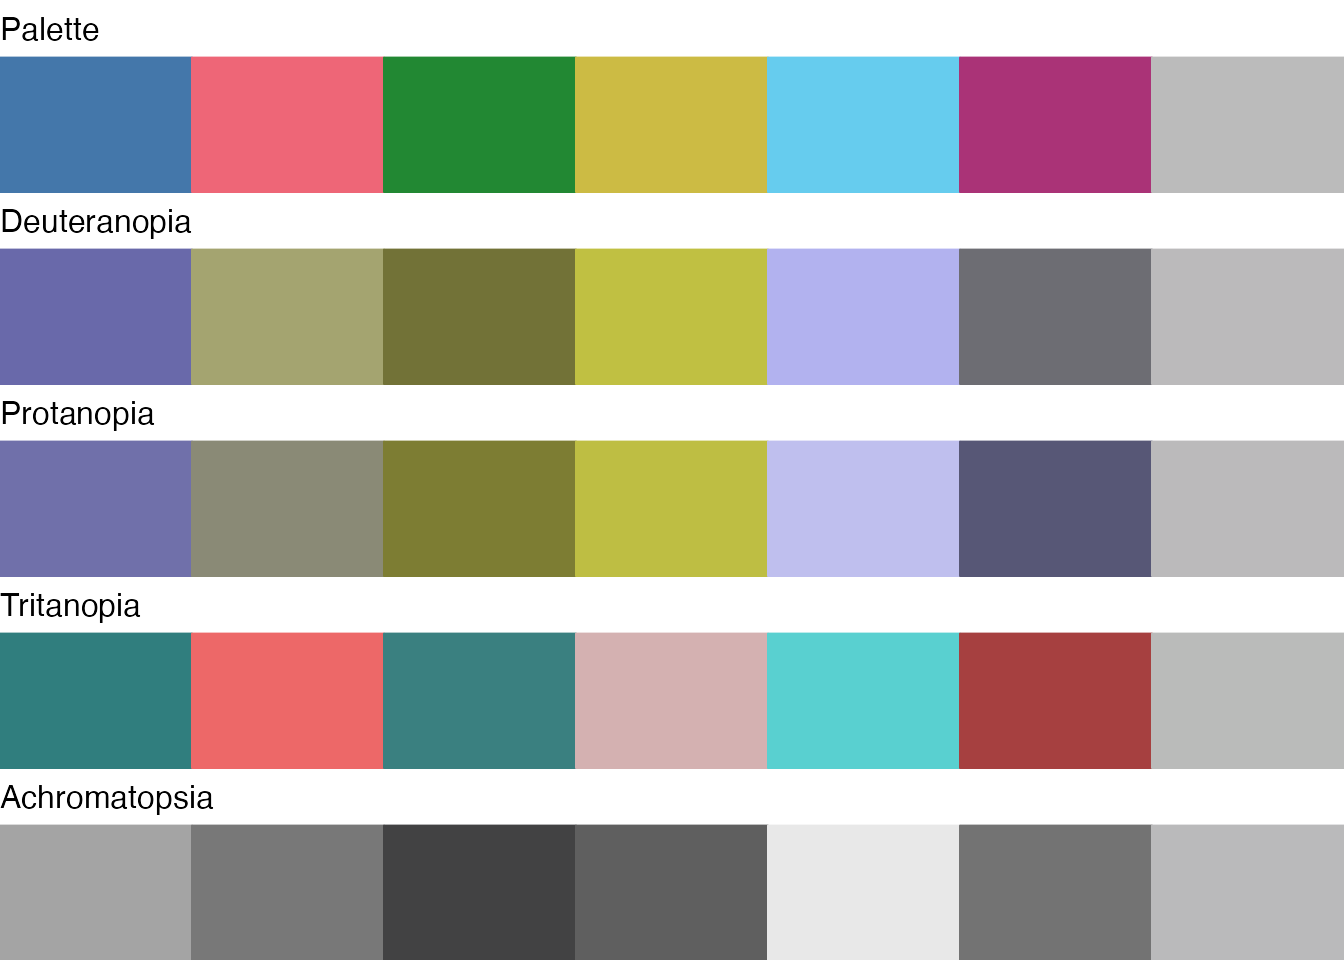
Each of the schemes have built-in ggplot scales in the form scale_color_{palettename} and scale_fill_{palettename}:
plot <- midwest |>
  filter(percbelowpoverty < 30) |>
  ggplot(aes(x = percollege, y = percbelowpoverty, color = state)) +
    geom_point(size = 3, alpha =.5) +
    scale_color_bright()

plotggplot2::midwest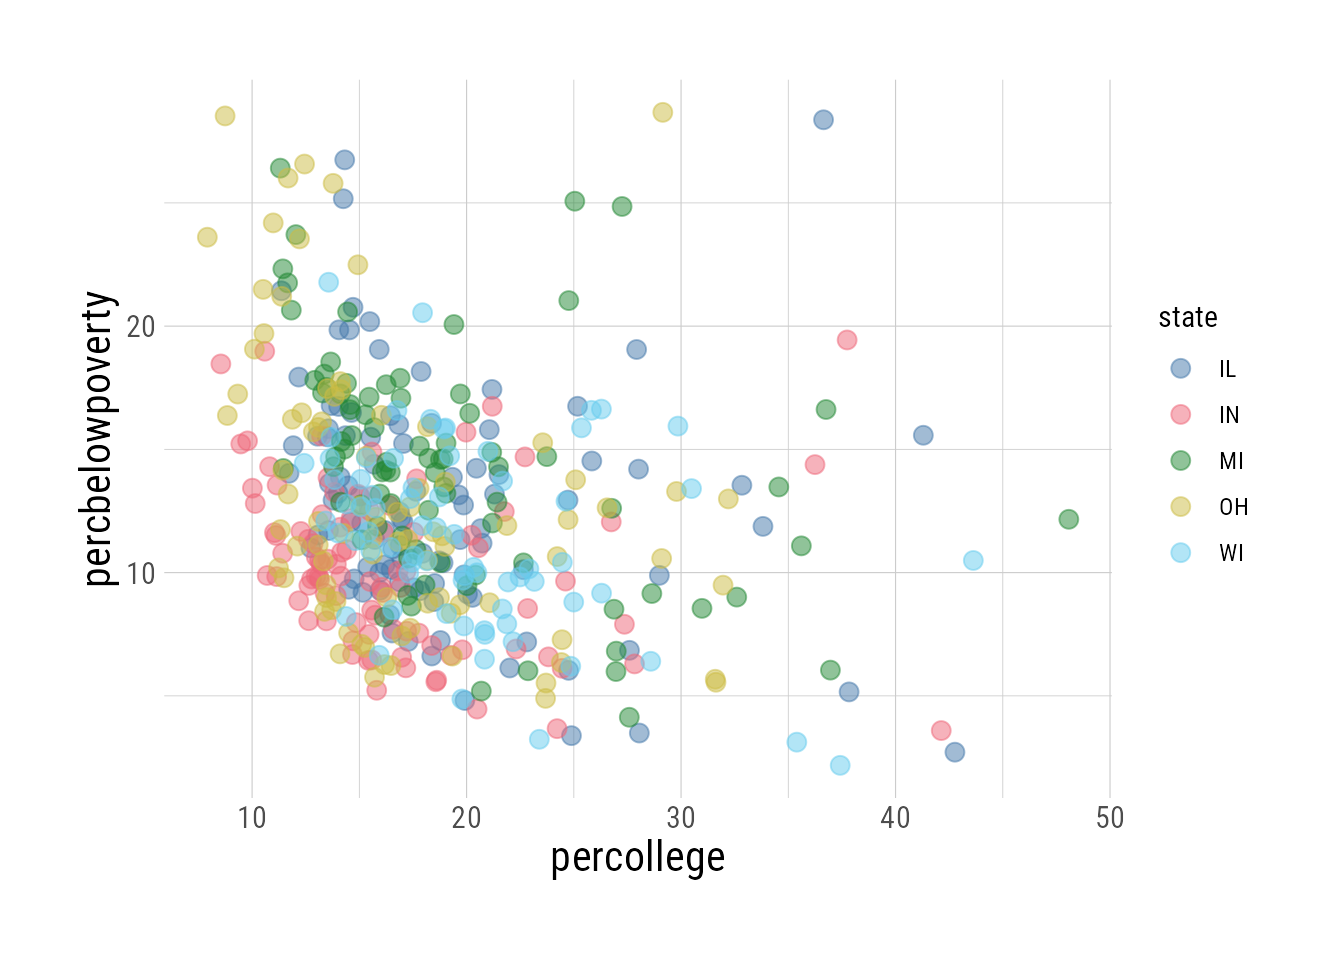
(NB: you can use the sequential and diverging type palettes for discrete/categorical data if you add the argument discrete = TRUE)
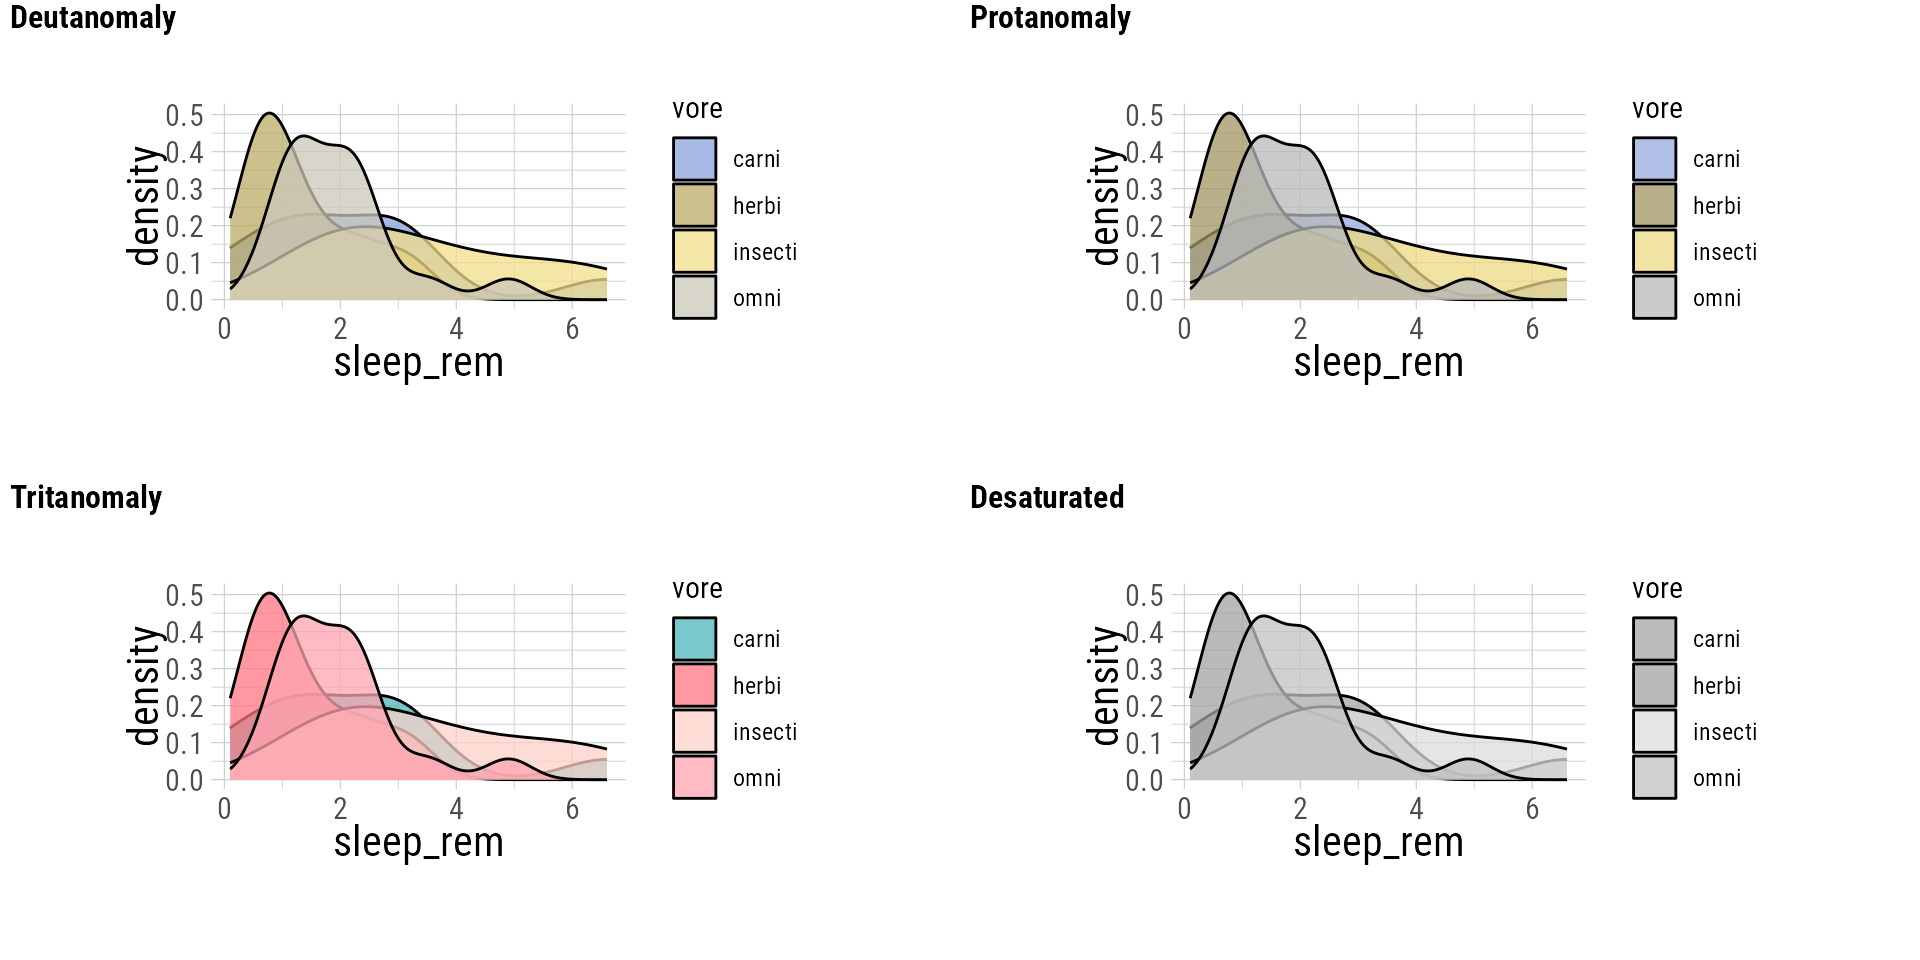
colorblindr - Preview your plots with colorblind simulation
colorblindr::cvd_grid will simulate how your plots will look to people with various types of colorblindness:
# remotes::install_github("clauswilke/colorblindr")
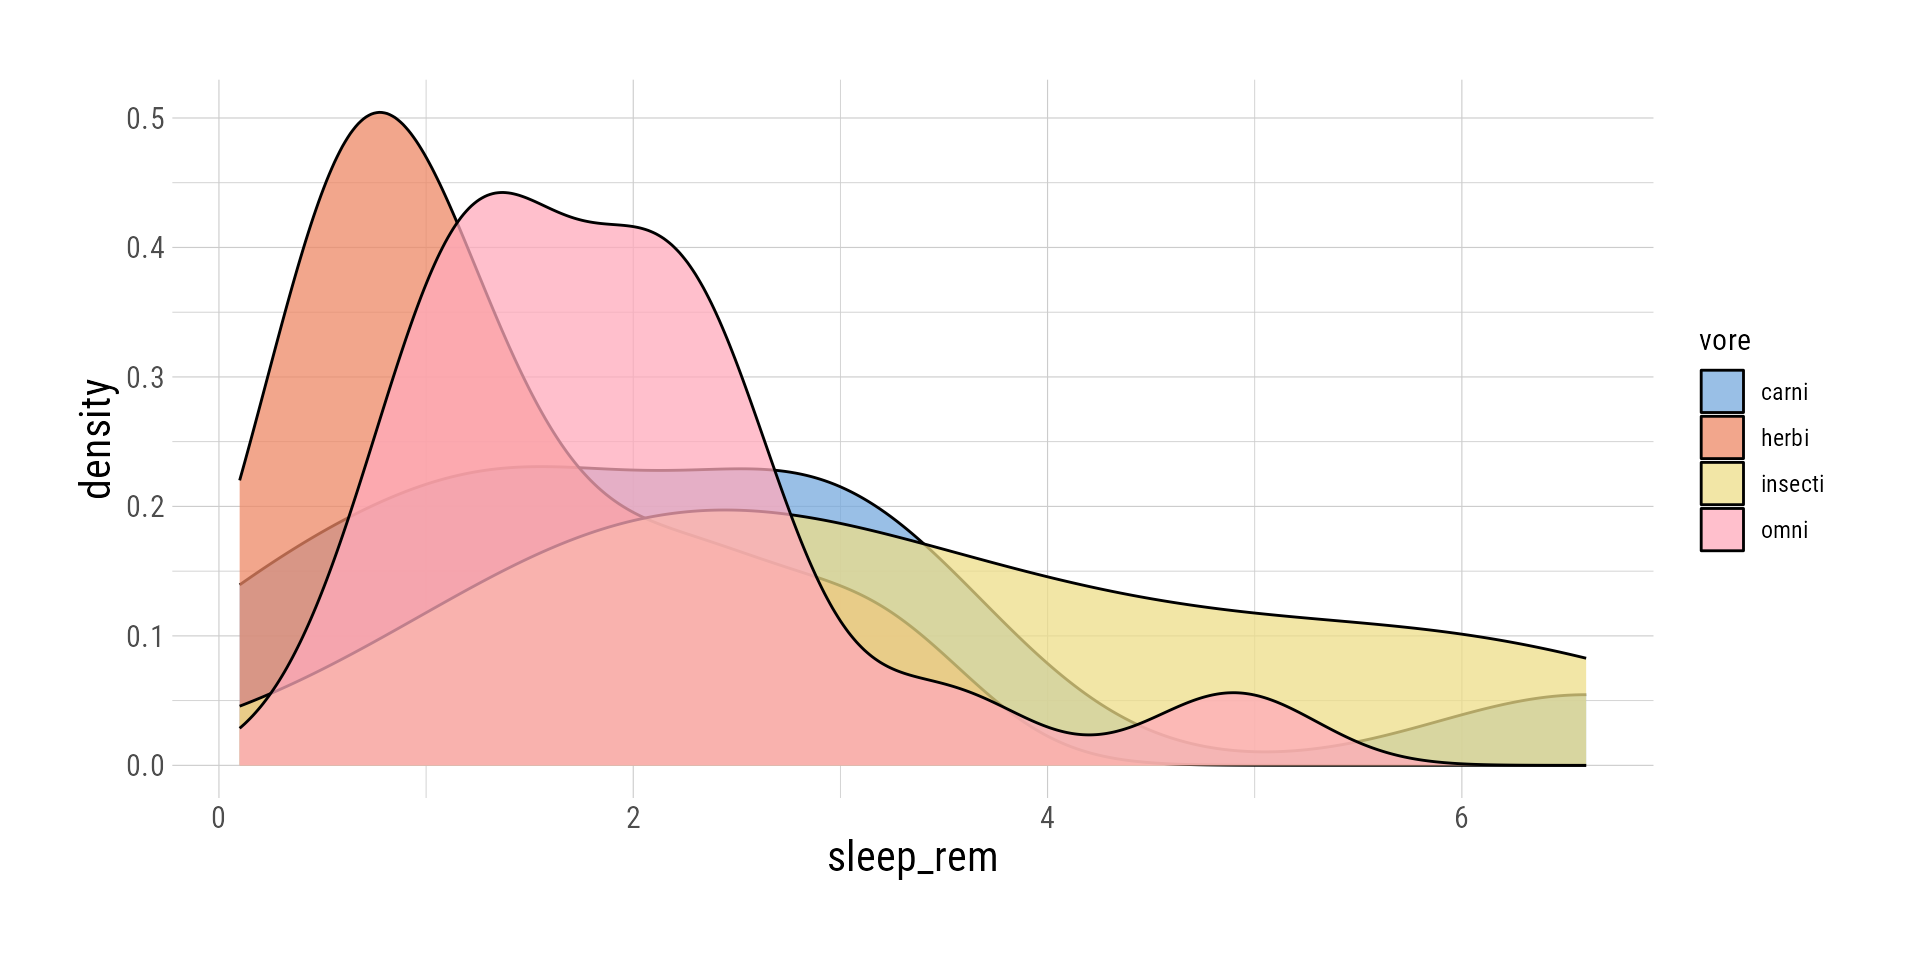
plot <- msleep |>
filter(!is.na(vore)) |>
ggplot(aes(x = sleep_rem, fill = vore)) +
geom_density(alpha = 0.75) +
scale_fill_light()
plot
colorblindr::cvd_grid(plot)ggplot::msleep).